Links: Send Keith a message | Sutton Intranet | Forensic Science site | Paul's Units | sutsci | Forensic news on the BBC |
23rd June :: ICT in Forensic Science next year. The scenario will be related to a company in Birmingham where the management have become aware that employees are downloading and exchanging pornographic material. You are asked to advise them as to what their legal liability is, what measures they can take to stop people being nasty, and how to bring the police in in such a way that the company is not crippled. Part of the background will be the systems the Police use to track people (or not as the case may be). I'd advise a look at the Bichard Enquiry Web site and perhaps reading pages 105 to 155 of the Bichard report - I'll have copies on Thursday. From page 104, para 2.148...
"Others, such as Mrs Giddings, did a batch on
one database at a time, and if left uncompleted she would
leave a Post-it note on the batch as to what had been
checked and what remained to be done. She was at a loss
to explain what would happen should the Post-it become
unattached! Some operators made a note on the original
Disclosure Form as they completed any action in relation to
it, others did not.
Really hi-tech, eh?
23rd June :: Consensus moderation complete and we have some work to do Thursday or Monday - not much - mainly to do with language and writing.
16th June :: In 700 we will be completing the 'flies' data report, and I hope to have feedback on your other work that will show what might need to be added to get high grades. I would suggest we then use the remaining Monday and Thursday lessons to add and refine material.
You might want to put all four of the tasks in a single folder or pocket file - then we can add a contents page at the front directing a moderator to the key bits. A printout of this page at the end would show a moderator what we have been up to over the year and the kinds of resources we have used.
I'll need to get Liz to check my final grades as this is the first time I have run this particular module.
7th June :: We did the calculations of the chi-squared statistic both using the Yates continuity correction and without for the four data sets on the handout. We used statistical tables of the critical value of the chi-squared statistic to find the 95% acceptance (5% rejection) chi-squared value for one degree of freedom - this turns out to be 3.841.
Data set A gives 4.2 odd chi-square without the Yates correction, dropping to 3.85 with the Yates correction. The other data sets were well below this. We aim to finish a mini-report on the six data sets and the pooled data on Thursday.
If you missed the lesson, the following links might be useful (along with the green handout on genetics from page 19 onwards for three or four pages).
- BMJ Statistics at Square 1 chapter on the chi-squared test (Web page)
- Adobe Acrobat version of a PowerPoint presentation about chi-squared tests and mendelian genetics (bit more than we need) (PDF)
- Flies breeding experimental protocol from a lab supplies company - includes all the calculations and a critical values of chi-squared table (pdf)
![]() Have a good whit bank holiday everyone and hang onto your wellies....June 7th we aim to crack the flies...
Have a good whit bank holiday everyone and hang onto your wellies....June 7th we aim to crack the flies...
27th May :: In 700 we built a spreadsheet to calculate the chi-squared statistic for a pair of observed results. Along the way, we looked at a few new spreadsheet functions. As an added bonus, my spreadsheet has a 'flies simulator' which simulates the proportion of vestigial and winged flies for a total brood of 60 flies.
If you missed the session, see if you can understand the formulas in the spreadsheet. Comparing the spreadsheet with the whiteboard screen shot below might help.
24th May :: Food for thought - Should we all file DNA samples with the police?
24th May :: We moved onto the flies experiment. If you toss two coins you can simulate the F2 breeding experiment with the flies. Call a 'head' a dominant gene and a 'tail' a recessive gene. Toss the coins 60 times (we did, and Laura recorded the results) and you get data like this...
- HH (represents AA): 16
- HT (represents Aa): 30
- TT (represents aa): 14
You can then say that the HH and HT 'genotypes' will manifest normal wings and the TT 'genotype' will have vestigial wings, so the observed data look like this...
| Winged | Vestigial | Total |
| 46 | 14 | 60 |
If the 'flies' obeyed Mendelian genetics exactly, so that there was a 3:1 ratio of Winged to Vestigial flies, you would expect outcomes like this...
- 3:1 ratio imples 1 + 3 = 4 equal shares
- 60 / 4 = 15 per equal share
- 15 × 3 = 45 winged flies
- 15 × 1 = 15 vestigial flies
So comparing the observed with the expected outcomes, we reach a table like this...
| Winged | Vestigial | Total | |
| Observed | 46 | 14 | 60 |
| Expected | 45 | 15 | 60 |
You can then calculate a 'chi-squared statistic' that tells you something about how different the observed and expected results are using the method shown in the whiteboard grab below...
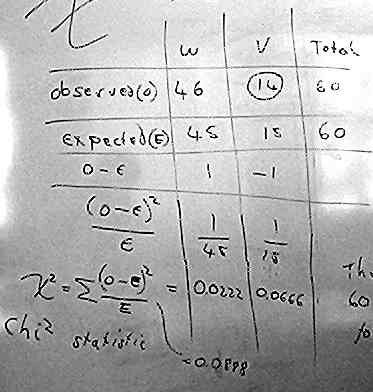
Next lesson. I'll be giving out a nice thick handout that explains all this - and you will construct a 'chi-square calculator' for the data.
24th May :: Monday - we will complete the gel report and move into the flies data. I've found a Genetics Lab Manual that has a lot of information on fruit fly experiments but it is a large PDF file (1.5 Mb, 5 minutes on a modem link). I'll provide printouts next week. I also found a report by a student with data on eye colour genetics.
21st May :: Forensic tests prove decisive yet again. Lynnette's enzyme data spreadsheet is here - anyone else care to send some data in? Ta
13th May :: In 223a this lesson to finish off the graph, get the formula and do some error analysis on the gel results. Then it is onto the fly data.
11th May :: We now have graphs of the natural logarithm of Base Pairs against the distance along the gel for the standard marker. The gradient and intercept of this graph gives us a formula in the form BP = A.e-kx where A and k are constants that depend on the particular gel. I have a draft handout dealing with all the Maths but it needs tweaking.
30th April :: Julie has sent me a graph paper link. You need 'Form 9B-BW.pdf'. Happy Monday all.
26th April :: Handouts on this morning's theory work by Thursday. The 'wikipedia' encyclopedia on the Web has some articles on electrophoresis...
- Gel electrophoresis as a general technique
- Argose gel electrophoresis
What do you think of these articles? The wikipedia is a bit unusual in that you (or anyone) can edit any of the pages...
20th April :: That mole came out of its hole again. I found a page with examples of each kind of mole calculation, the examples are written in three ways (formula, word formula and specific example with figures). Might be handy.
19th April :: We ran the foam dice radioactivity simulation with some interesting results and looked at error bars. Bring the gel data to Thursday's lesson and we'll use Excel to plot curved and log graphs.
29th March :: Napier's bones are another old calculating technique. We reviewed work on powers and indices, and introduced the idea of a logarithm.
28th March :: I'll be completing the review of straight line graphs and revising powers tomorrow. I'll also be introducing the log function. You can download some handouts...
Graphs | 1 | 2 | 3 | 4 | Excel graph formula demo | Excel Log tables |
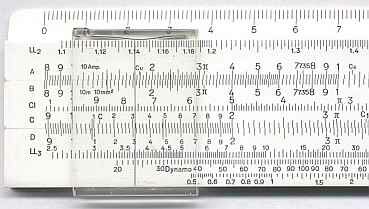
I wonder what this strange ruler like device is for...
25th March :: Those who made it to 700 used the time to
- revise straight line graphs
- make a spreadsheet based on the data from Monday's lesson and use the trendline feature in Excel to draw the line of best fit
- loaded a gel photo into MS PhotoEditor and adjusted the brightness and contrast to show the bands to best advantage
22nd March :: We went thru' the plotting of a straight line graph based on data with some scatter present, drawing a line of best fit, finding the gradient and intercept from the line, and then devising a formula from the gradient and intercept....

I'll be going back over this in 700 using Excel to find the line of best fit, the gradient and intercept.
The s-cool revision site has a very nice interactive graph plotting activity on the page about algebraic graphs.
20th March :: Here is a simple idea I pinched off Harjit's Forensic Science site. The 'Forensic news on the BBC' link above actually runs a search on the BBC web site for any news items that have Forensic Science in the article or category.
18th March :: On Monday, we covered the basic idea of a straight line graph derived from a rule and described by a formula. The example used was "Turkey cooking times: 20 minutes for each pound plus 30 minutes". Amanda revealed hidden feelings about turkeys. Mind you, the highlight of the week had to be boiling maggots fed on catfood....
Scool section on straight line graphs. Use the message form if you want the units we used by e-mail.
12th March :: "Initially we thought it was a burglary, but after forensic evidence we had to turn the investigation round and start again." - Detective Inspector Neil Treaby on the 'most difficult case he has ever handled'.
On Monday I would like to try to complete task 2 and start the background Maths for task 3. I'll get a pack together for those of you who are not able to attend as often as you would wish.
11th March :: Rusedski cleared by 'analytical footprint' of the nandrolone he was accused of taking. Forensic techniques get everywhere.
In 700 tomorrow finishing the write up.
9th March :: We have managed to complete the confidence interval calculation and some have written outline reports. Paul has given us a model witness statement. In 700 this Thursday, we can write up the whole thing. I'll put all the handouts here for people to download.
29th Feb :: Tomorrow, we will be looking at writing the report on the pellets calculation. Anyone who wants a catch up workshop, just use the contact form.
16 Feb :: As it is reading week, here is one from the BBC Web site: Hair could tell drinking secrets... Have a good week.
09 Feb :: We did a 'dummy run' of a statistical test on the coin data today. As promised there is a link to the page I revised the formula from, and a summary of the idea of a formal statistical test. I have put this information in a separate page.
05 Feb :: Added in retrospect - we built a spreadsheet calculating the mean and standard deviation for the 'old' and 'new' coins.
02 Feb :: We started task 2 today - the strange case of the air gun, the neighbour and the cat. Reza Moghaddam has found an interactive micrometer animation with an introduction page from the University of Toronto. Note that the version on the Web site reads 0 to 50 on the thimble scale and half mm divisions on the main scale. The micrometers we use read whole mm's on the main scale and 0 to 100 on the thimble.
26th Jan :: Task 2 start :: Are older 1p coins thinner than 2003 issue 1p coins? We measured some coins using a screw micrometer and collated data for processing on Thursday in 700. You can download the handout and there is a diagram of a micrometer below...

and a photo of the instrument..

22nd Jan :: Earprints!? On Monday we are doing measurements as a dry run for task 2.
22nd Jan :: In 700. We will try using Excel's curve fitting to make a cumulative frequency curve. There is a Web page that you can use to check calculations by copying and pasting data and to save typing there is some sample data in a CSV file.
19th Jan :: Picked up the cumulative frequency curve where we left off and completed that, and used a curve to find the median and upper and lower quartile. Compared the semi-interquartile range with the standard deviation.
12th Jan :: We looked at the whole cycle of choosing classes, tally chart, histogram, frequency polygon, cumulative frequency curve. Theresa has found an excellent University level stats site from Australia called surfstat. A good starting point would be Summarising and Presenting data from that site. We have been looking at Measures of Central Tendency and Measures of Variability up to now, as well as the Normal Distribution.
John Matthew's introduction to statistics (the 'pink notes') is still one of the clearest I have read and we will read thru' this when you have got some data to analyse.
8th Jan :: Room 700! We will use a simulation of a histogram to explore what happens as you increase the number of results... The simulation should open in a new window.
- Try 100 results, and plot 5 or 6 histograms. How 'jagged' to they look?
- Next try 500 results, and 1000 results, and 5000 results
- What is happening as you increase the number of results? What does the histogram look more like?
5th Jan :: We did histograms (Unit 33 from the yellow pack) and then talked about the Normal distribution and some other distribution shapes.
31st Dec :: I must tidy my desk. Happy new year.
![]()
Happy xmas! Your Christmas present is some reading on statistics! Yes, I am sad :-)
If you read up to about page 12 of the introduction to statistics provided by John Matthews of Newcastle University you will have made an excellent start to the new year! I'll be going over that material with plenty of examples in January.
17th Dec :: News item - databases can be tricky. You get to study IT in relation to forensic science practice in the second year. Thursday's lesson will be feedback and consolidation on the lab project. Liz and I are impressed with all the work we have seen so far.
15th Dec :: More work on the lab design task. From what I have seen so far, a lot of thought has gone into your responses to this task and there is a definite eye for detail. Now we just need to see the big picture.
11th Dec :: Well, we ended up in 700 doing the five number summary in Excel. Do what you can to the Lab designs on Monday and I'll give feedback by Thursday.
8th Dec :: We did the area and volume of the Lab, then calculated the max and min areas consistent with the accuracy of the measurements. I presented two methods for finding the area of the octagonal benches but with some gaps for you to fill in. I'll have a handout by Thursday on those. I imagine most people will want to spend a bit of extra time on the assignment this Thursday so we'll be in 223a.
4th Dec :: We did the mean and standard deviation of some data based on the diameter of shotgun pellets. This is a theme for the second task on the Maths module assignment. I was also asked for clarification of the Maths tasks and when they will be due. I'll be giving out this summary on Monday.
News :: Sheffield University are doing something fascinating with face recognition - this was on the radio news this morning. If I was a young Maths undergraduate again, this is the kind of job I'd be going for.
1st Dec :: We did some more work on lab design assignment. The main calculation was on getting an upper and lower bound for the area of the lab. See my whiteboard notes. We did sample layouts using the cutout outlines of the lab benches. 12 or 15 people looks like a maximum for Room 151.
Please remember to have a look at the Web links provided by the second years and use the contact form to send some feedback.
27th Nov :: Detecting traces of explosive has become topical (and close to home).
We looked at Excel and produced a lot of interesting graphs. The most useful are the XY or scatter plot and the bar charts (% and normal). I found a page about scatter diagrams in a Chemistry context.
26th Nov :: I asked the second years to pick a Web site each and to say which unit they used it for and why it was good. Can you have a look at their work and send me a comment if you found one useful?
24th Nov :: Investigating the octagonal benches. The benches sit inside a square of side 181cm. You can calculate that the sides must be 75cm long. Next week we do the area calculations. Room 700 Bay 5 on Thursday.
20th Nov :: We did mostly Unit 19 on probability. Unit 17 (charts) will be done in Room 700 (the computer bay) on the 27th. I've found a page about genetics that might be similar to what you are doing to the flies. I'd check this with Liz as this definitely isn't my bag.
17th November :: This lesson was checking lab measurements, resolving inconsistencies and discussing accuracy levels. We decided that if you round the measurements to the nearest 10 cm, when you divide by 50, you end up with figures that can be recorded to one small square on the graph pad we use. We also calculated the volume of room 151 and I found some stuff on air changes per hour from a US source. You could ask Malcolm if he knows about UK regulations.
12th November :: Those who came did the exercise very well. I'll place it in context next week. That mole came out of its hole so I'll have a Paul-proof handout for Monday. PS The molecular mass of DNA seems to be a bit of a complicated question.
12th November :: If we can get the log-ins sorted, we will be typing a simple data set into Excel and producing a scatter diagram.
10th November :: Puzzle. Your signature weighs 5 microgrammes. The gell pen ink has a molecular weight of 1275. How many molecules of ink are in your signature? [ answer ]
10th November :: People made a start on measuring the room 151, 151a and 153 area as a basis for a Lab design. Malcolm B has issued a useful booklet on Forensic lab design. Meet in Room 700 12 noon Thursday to initialise your log-ins and to do some statistics on Excel.
6th November :: We looked at some statistical vocabulary and did some problems around transposing the formula for the mean or average (mean = total / number).
3rd November :: We did the sine, cosine and tangent lesson today instead of last lesson. The BBC Byte Size Web page is relevant. Meet in 223a for Thursday lesson. I'm developing (with Reza Moghaddam who teaches the two other BND groups) a summary of the Maths unit content with examples. Don't print this one as it will change over the next few weeks.
23th October :: Sine, cosine and tangent. Transposing formulas. BBC Bitesize has some revision material on trigonometry. Note - we actually ended up doing angles.
20th October :: More work on Pythagoras result. There are some good exercises pinched from a Web site done by a school maths teacher. Steve Baker at Great Barr pinched my digital camera and pointed it down a microscope (with some Access students) and came up with these images of cells.
16th October :: We'll have a look at The Blob and then move onto Pythagoras's result.
13th October :: Areas of rectangle, triangle and trapezium and leading up to The Blob - an exercise in measuring the area of an irregular shape using two different methods. This work supports the Laboratory Design task coming shortly...
9th October :: Completed scale plan and talked about the Unit 6 spec for the Maths and Stats unit and a likely first task around designing a laboratory.
6th October :: We did percentages with a calculator. Can everyone bring the scale plan data to this Thursday's lesson?
- Basic review of percentages
- Some word problems with answers
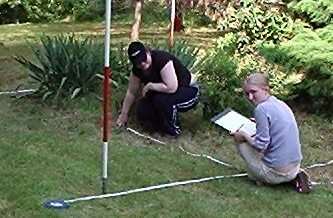
3rd October :: See photos of students measuring T40! Up for a month only to protect the camera shy!
2nd October :: De-brief volume of a sphere and then produce a scale plan of the portacabin. There is a good example of a working sketch on the changing places Web site of all places. You can download the worksheet if you need to.
29th September :: I found a useful summary of standard form and an online quiz for you to try. The Powers of Ten web site might help you get your head around large and small distances. The solutions to the worksheet are here as well.